While working on SodaCity at first there were only a couple of dozen of objects in the scene but as the complexity grew, more and more objects were at the scene.
At the end of the project even a few thousands of objects were active, each one doing its things, enemies, bullets, trace effects, smoke particles, background animations, environment SFX, you name it.
At some point I started to see a decay in performance and I couldn't get to the source of the problem because the Unity Profiler was accounting a lot of the CPU usage to the 'Other' category.
Usually when you start your way into Unity3D, books, blogs, tutorials you are told how to use the main methods Unity uses Awake, Start, Update, LateUpdate and OnDestroy. But not really often they mention the overhead this causes.
Because MonoBehavior does not provide abstract or virtual methods for you to override, the only way it knows if a given behavior needs a particular method to be invoked it needs to use Reflection to figure it out. Besides I believe this causes overhead as it needs to get a hold of the reflected method and call invoke over the given object, etc.
So I decided to put my theory to the test.
You can download the test project from here.
To see details on the tests performed, continue reading...
These tests were made with Unity 4.3
Note: I do recommend to disable VSync to be able to get the maximum number of FPS for each test.
Edit->Project->Quality
The Setup
It is a simple scene, no Jebediah sprites this time, it just has a camera, a FPS counter and a Setup object with 5 child objects that are going to be used as the TestManagers.

The 'Setup' object will have references to the five TestManagers and will be responsible to show simple GUI Buttons and handle mouse events to activate / deactivate the corresponding TestManagers. It will also set the FPS cap to 300.

When run it will show the blue screen, the FPS counter at the top left corner and the five buttons.
Because when the 'Setup' object is loaded it disables the child test objects so the FPS counter should be around 300fps.

The Profiler should show that most of the frame time is spent waiting for the target FPS.

The Test
The code to test is simple, and uses methods that are common for most game sub-systems operations.
for(int i=0; i< 10; i++){
    this.v1 = new Vector3(Random.Range(1f,100f),Random.Range(1f,100f),Random.Range(1f,100f));
    this.v2 = new Vector3(Random.Range(1f,100f),Random.Range(1f,100f),Random.Range(1f,100f));
    this.v3 = new Vector3(Random.Range(1f,100f),Random.Range(1f,100f),Random.Range(1f,100f));
    Vector3 delta = this.v2 - this.v1;
    delta.Normalize();
    this.v3 += delta * this.magnitude;
}
It will randomly generate three Vector3 then will calculate the delta between the first two then normalize that delta then scale it by a fixed magnitude and assign it to the third vector. All that 10 times per call/invocation.
The different tests will handle this same algorithm in various ways in order to measure the impact of each implementation.
To create a reasonable load each TestManager will create 1000 objects from the specified prefab.
Test #1 - Update Method
This test will use the default Update method invoked by the UnityEngine itself for every GameObject with the 'UpdateTest' behavior attached.
using UnityEngine;
using System.Collections;

public class UpdateTest : MonoBehaviour {

    private Vector3 v1;
    private Vector3 v2;

    private float magnitude;

    private Vector3 v3;

    void Awake(){
        this.magnitude = Random.Range(1f,100f);

    }

    // Update is called once per frame
    void Update () {
        for(int i=0; i< 10; i++){
            this.v1 = new Vector3(Random.Range(1f,100f),Random.Range(1f,100f),Random.Range(1f,100f));
            this.v2 = new Vector3(Random.Range(1f,100f),Random.Range(1f,100f),Random.Range(1f,100f));
            this.v3 = new Vector3(Random.Range(1f,100f),Random.Range(1f,100f),Random.Range(1f,100f));
            Vector3 delta = this.v2 - this.v1;
            delta.Normalize();
            this.v3 += delta * this.magnitude;
        }
    }
}
This behavior will be attached to a prefab.

And this prefab will be linked to the UpdateTestManager object.

using UnityEngine;
using System.Collections;

public class UpdateTestManager : MonoBehaviour {

    public UpdateTest Prefab;

    public int Count = 100;

    void Awake(){
        Transform current = this.transform;
        for(int i=0; i< this.Count; i++){
            var obj = (UpdateTest)Instantiate(this.Prefab);
            obj.name = string.Format("{0}_{1:00}", this.Prefab.name, i);
            obj.transform.parent = current;
        }
    }

}
When run and the UpdateTest is selected the FPS counter will drop considerably.

At the profiler we can identify that UpdateTest.Update() is being called a thousand times it is taking the 79.7% of the frame execution time. Also take notice of the Overhead "method" is shown consuming 15.8% of the frame time.

Test #2 - Method Invoke
In this test the 'MethodInvocationTestManager' will invoke the 'DoStuff'' method of the 1000 'MethodInvocationTest' objects it created.
using UnityEngine;
using System.Collections;

public class MethodInvocationTest : MonoBehaviour {

    private Vector3 v1;
    private Vector3 v2;

    private float magnitude;

    private Vector3 v3;

    void Awake(){
        this.magnitude = Random.Range(1f,100f);

    }

    public void DoStuff(){
        for(int i=0; i< 10; i++){
            this.v1 = new Vector3(Random.Range(1f,100f),Random.Range(1f,100f),Random.Range(1f,100f));
            this.v2 = new Vector3(Random.Range(1f,100f),Random.Range(1f,100f),Random.Range(1f,100f));
            this.v3 = new Vector3(Random.Range(1f,100f),Random.Range(1f,100f),Random.Range(1f,100f));
            Vector3 delta = this.v2 - this.v1;
            delta.Normalize();
            this.v3 += delta * this.magnitude;
        }
    }

}
This behavior will be attached to a prefab.

This prefab will be linked to the 'MethodInvocationTestManager' object.

using UnityEngine;
using System.Collections;

public class MethodInvocationTestManager : MonoBehaviour {

    public MethodInvocationTest Prefab;

    public int Count = 1000;

    private MethodInvocationTest[] items;

    void Awake(){
        Transform current = this.transform;
        this.items = new MethodInvocationTest[this.Count];
        for(int i=0; i< this.Count; i++){
            var obj = (MethodInvocationTest)Instantiate(this.Prefab);
            obj.name = string.Format("{0}_{1:00}", this.Prefab.name, i);
            obj.transform.parent = current;

            this.items[i] = obj;
        }
    }

    void Update () {
        for(int i=0; i< items.Length; i++)
            this.items[i].DoStuff();
    }
}
When run and the MethodInvocationTest is selected the FPS counter will drop but will keep slightly above the 'UpdateTest'.

The profiler will show only one call to 'MethodInvocationTestManager.Update()' method taking most of the frame execution time. But the Overhead "method" will only consume 1.6% of the frame execution time. This implementation reduces the Overhead execution time by 90% of the 'UpdateTest'.

Test #3 - Managed
In this test the, in the spirit of trying to remove the overhead of invoking a method within the update loop, the 'ManagedTestManager' will actually execute the algorithm and will use the 'ManagedTest' objects only as data repositories.
using UnityEngine;
using System.Collections;

public class ManagedTestManager : MonoBehaviour {

    public ManagedTest Prefab;

    public int Count = 1000;

    private ManagedTest[] items;

    void Awake(){
        Transform current = this.transform;
        this.items = new ManagedTest[this.Count];
        for(int i=0; i< this.Count; i++){
            var obj = (ManagedTest)Instantiate(this.Prefab);
            obj.name = string.Format("{0}_{1:00}", this.Prefab.name, i);
            obj.transform.parent = current;

            this.items[i] = obj;
        }
    }

    void Update(){
        ManagedTest obj = null;
        int x = 0;
        for(int i=0; i< items.Length; i++){
            obj = this.items[i];
            for(x=0; x< 10; x++){
                obj.v1 = new Vector3(Random.Range(1f,100f),Random.Range(1f,100f),Random.Range(1f,100f));
                obj.v2 = new Vector3(Random.Range(1f,100f),Random.Range(1f,100f),Random.Range(1f,100f));
                obj.v3 = new Vector3(Random.Range(1f,100f),Random.Range(1f,100f),Random.Range(1f,100f));
                Vector3 delta = obj.v2 - obj.v1;
                delta.Normalize();
                obj.v3 += delta * obj.magnitude;
            }
        }
    }
}

When run the FPS counter shows numbers similar to the 'MethodInvocationTest' thus not showing a real improvement over the previous method.

The profiler will still show the Overhead "method" at a 1.5% of the frame execution time.

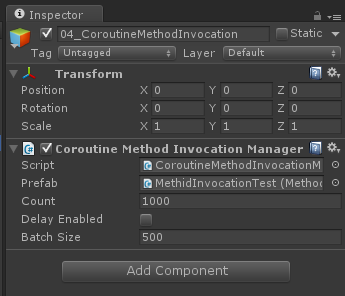
Test #4 - MethodInvoke from a Coroutine
In this test the 'CoroutineMethodInvocationManager' will create a Coroutine when enabled and will loop over the 1000 'MethodInvocationTest' it created each frame, The objective here is to measure if by moving the code out of the "Update" method altogether improves performance.
private IEnumerator doStuff () {
        while(Application.isPlaying){
            yield return null;
            for(int i=0; i< items.Length; i++)
                this.items[i].DoStuff();
        }
    }
When run the FPS counter shows numbers similar to the 'MethodInvocationTest' and 'ManagedTest' thus not showing a real improvement over the previous methods.

In the profiler the mostly the same numbers can be observed, but it shows an increment over the Overhead "method" indicating that it is more expensive to have a every-frame-yielding coroutine that having only one 'Update' method call.

Test #5 - MethodInvoke from a Coroutine with Batching
Basically this is the same test as the Test#4, but having a Coroutine object already created give us more flexibility and opportunities to enhance the overall performance.
We will doing this by processing the entire 1000 objects in batches of 500.
    private IEnumerator doStuffWithDelay(){
        while(Application.isPlaying){
            yield return null;
            for(int i=0; i< items.Length; i++){
                this.items[i].DoStuff();
                if(i >0 && i % this.BatchSize == 0)
                    yield return null;
            }
        }
    }

When run we can observe an amazing increase in the FPS counter.

The profiler still will show an small increase on the Overhead "method" but the gains in FPS surely are worth of it.

Conclusion
For collection of objects like enemies, bullets, explosions, drops, props, etc. It is highly recommended to avoid using the 'Update' method on behaviors attached on this kind of objects.
Instead this behaviors should subscribe themselves to a manager that will handle the 'Update' execution of the desired behavior methods. (Test #2)
For non sensible objects like props, particles, standard npcs and such it is recommended to batch the execution of the behavior methods. Running at a lesser update rate that the rest of the game engine but allowing more sensible code to be run in that time, improving the overall FPS.
This batching can be fixed, item count based, time based or any reasonable combination. keeping in mind that using coroutines will increase the overhead a little. (Test #5)
Please feel free to download the test project, run your own tests, make changes and provide feedback.
Leave your findings, questions or doubts in the comments below.
The Overhead profiler element is reporting the time spent on non-project features which in most tests like this is actually the cost of profiling - capturing the samples, rendering them in the Profiler UI and so on.
ReplyDeleteThe area you want to look at for Update() overhead is the BehaviourUpdate timeslice.
Heya!
ReplyDeleteWhile exploring knowledge & concepts on Unity Game Engine, I am glad I came across your article. This is quite helpful. Thanks for sharing.
What Are the Odds of Onco in Vegas Casino? - Casino
ReplyDeleteYou're looking to find out whether on-the-line on-line bets クイーンカジノ are really worth it, jeetwin and where to make some money. $10 bet 온카지노 at the Wynn Las Vegas.